Built as a Learning Tools Interoperability (LTI) integration for the learning management system Canvas, Threadz is a discussion visualization tool that adds graphs and statistics to online discussions.
Screencast of Threadz
Overview
Faculty are continually looking for new ways to engage their students with the content of their courses. The use of web-based discussions has grown from being a tool strictly for use in online courses to being ubiquitous in all courses regardless of modality.
There is a tremendous amount of untapped information available from a Learning Management System (LMS) regarding student and teacher interactions. The data found in an online discussion can be used to decipher behaviors and identify connections between individuals in a course and their integration in the learning environment. Unfortunately, this data is often hidden from students and teachers.
By looking at the social network connections in a discussion, patterns emerge on the activities and conduct of individuals and groups. An instructor can use these patterns to identify behaviors and characteristics within the course, such as: learner isolation, non-integrated groups, instructor-centric discussions, and key integration (power) users and groups.
Application of Threadz
When an instructor connects the Threadz LTI to their course, they gain the ability to better understand student engagement. One of the most important concepts within Threadz is its ability to identify student and group behaviors (e.g., isolated learners and domination) that are otherwise obfuscated. Instructors can now use this information to determine when and how to intervene and interact with individuals or groups. An element that is often forgotten within discussions is the impact of instructor interactions – Threadz helps the instructor to understand their level of involvement and whether an adjustment is in order.
Threadz furnishes information necessary to assist instructors with making data-driven decisions about their pedagogical goals and how to improve the educational environments for students to learn. The significance of Threadz is that its visuals can quickly provide order to data stemming from the discussion forum, thus providing the tools for an instructor to gain an understanding of what may need adjustment.
Threadz employs dynamic visualizations based on data extracted from LMS data and embed back into the LMS for easy access. The visual representations created from online discussions assist in identifying specific behaviors and characteristics within the course. These behaviors include: learner isolation, non-integrated groups, instructor- centric discussions, and key integration (power) users and groups. By identifying these elements within a discussion, the instructor can affect change in these interactions.
Online discussions provide valuable information about the dynamics of a course and its constituents. Much of this information is found within the content of the posts, but other elements are concealed within the social network connection and interactions between students and between students and instructors. Threadz is a tool that extracts this hidden information and provides communicators with immediate feedback.
The overriding goal of Threadz is to foster communication while also providing a tool for faculty and students to explore the dialogue in their classroom. The visualizations attract the attention of the user, drawing them in and engaging them with the information. The displays are easy to decipher and are offered in multiple formats to better describe meaning to the user.
Any student and teacher enrolled in the course can utilize Threadz. It provides valuable information about the constructs of the social network patterns for individual discussions. These patterns highlight student behavior characteristics about student interactions within a discussion as well as assist instructor adjustments within learning environments to improve student success. Exploring these issues helps an instructor to learn more about and strengthen the communication in their course.
Threadz is intended to be intuitive and insightful - the meaning of each visualization can be easily interpreted at a glance. Visualizations are a key element to Threadz; they help shape a shared view of the communication framework within a course and are important to the success of the students.
Dirctional Chord Diagrams
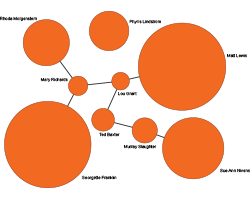
The chord diagram displays the directional paths of the interactions between two users. The count of posts is represented by the thickness of the line. Threadz uses a dynamic interface allowing the user to hover over the outer edge of the circle on a specific user to display the number of posts sent and received. Hover over the chord line that connects two students to display the count of posts from either direction.
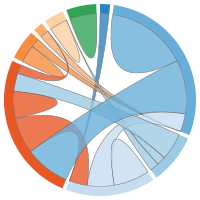
Chord diagram showing direction of posts
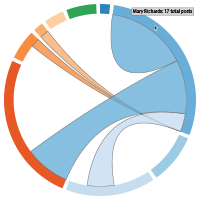
Chord diagram showing direction of posts for an individual
Social Network Diagrams
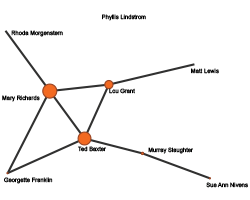
The social network visualizations show typical line/node graphs that connect users together. Each node represents a different user in the discussion and each line represents a post from or to another user. The relative size of the circles (nodes) can be changed to represent the value selected for either the number of posts sent, posts received, total posts, total word count of posts sent, and the average word count of posts sent by that individual. These charts are useful to quickly discern any individual or group that is isolated or is a driving hub within the forum.
The nodes in this chart are movable to help single out individuals or groups when the network of connections gets too complex visually. To manipulate a node, click and drag a node circle to another part of the page where it will then be locked into that location until being released by a double click.
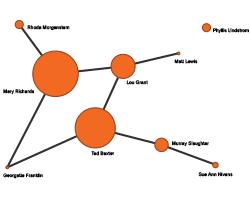
Network Graph showing total posts
Network Graph showing total posts sent by individuals
Network Graph showing word count of posts
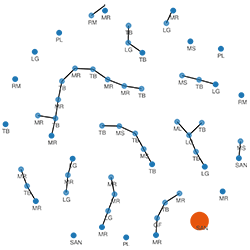
Threaded Network Diagrams
The threaded network visualizations show typical line/node graphs that connect each discussion post together. Each node represents a different post in the discussion and each line connects a post to a responding post. Response posts are identified with a paler color from the original beginning thread comment. These charts are useful to quickly discern the structure and volume within the forum.
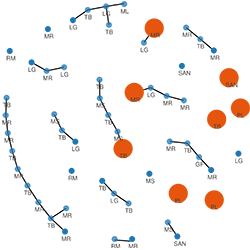
As seen in the images below, the node color and size change depending on the selected chart. Late posts, unread posts and learners that are isolated from the rest of the class can be highlighted in orange. The size of the node may also change relative to the length of the post.
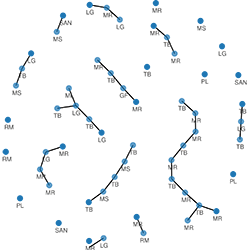
Network Graph showing individual posts/replies
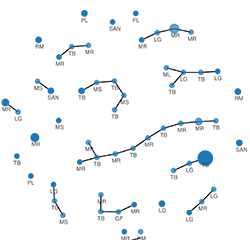
Network Graph showing post length
Network Graph showing unread posts
Network Graph showing late posts
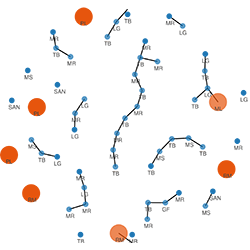
Network Graph showing isolated learner posts
This tool was created at Eastern Washington University by Instructional Technology Design and Development.
Matt Lewis was the project lead and head programmer. Please contact us at instructionaltech@ewu.edu for more information about Threadz. In it's current state, Threadz does not support other LMS platforms besides Instructure's Canvas. If you are interested in developing Threadz for a different LMS please contact us, we'd enjoy partnering with you.

License
Threadz has been licensed by Eastern Washington University under a Creative Commons Attribution-NonCommercial-ShareAlike 4.0 International License. The source code for Threadz has been made available as a shared repository to allow for updates to be pushed out to other institutions as well as for others to add and update the source code. The code has been structured to make updates and expansions readily accessible. Threadz is currently available on the GitHub repository.

Threadz by Eastern Washington University - Instructional Technology is licensed under a Creative Commons Attribution-NonCommercial-ShareAlike 4.0 International License.